Linear Regression
Linear regression predicts a real-valued output based on an input value.
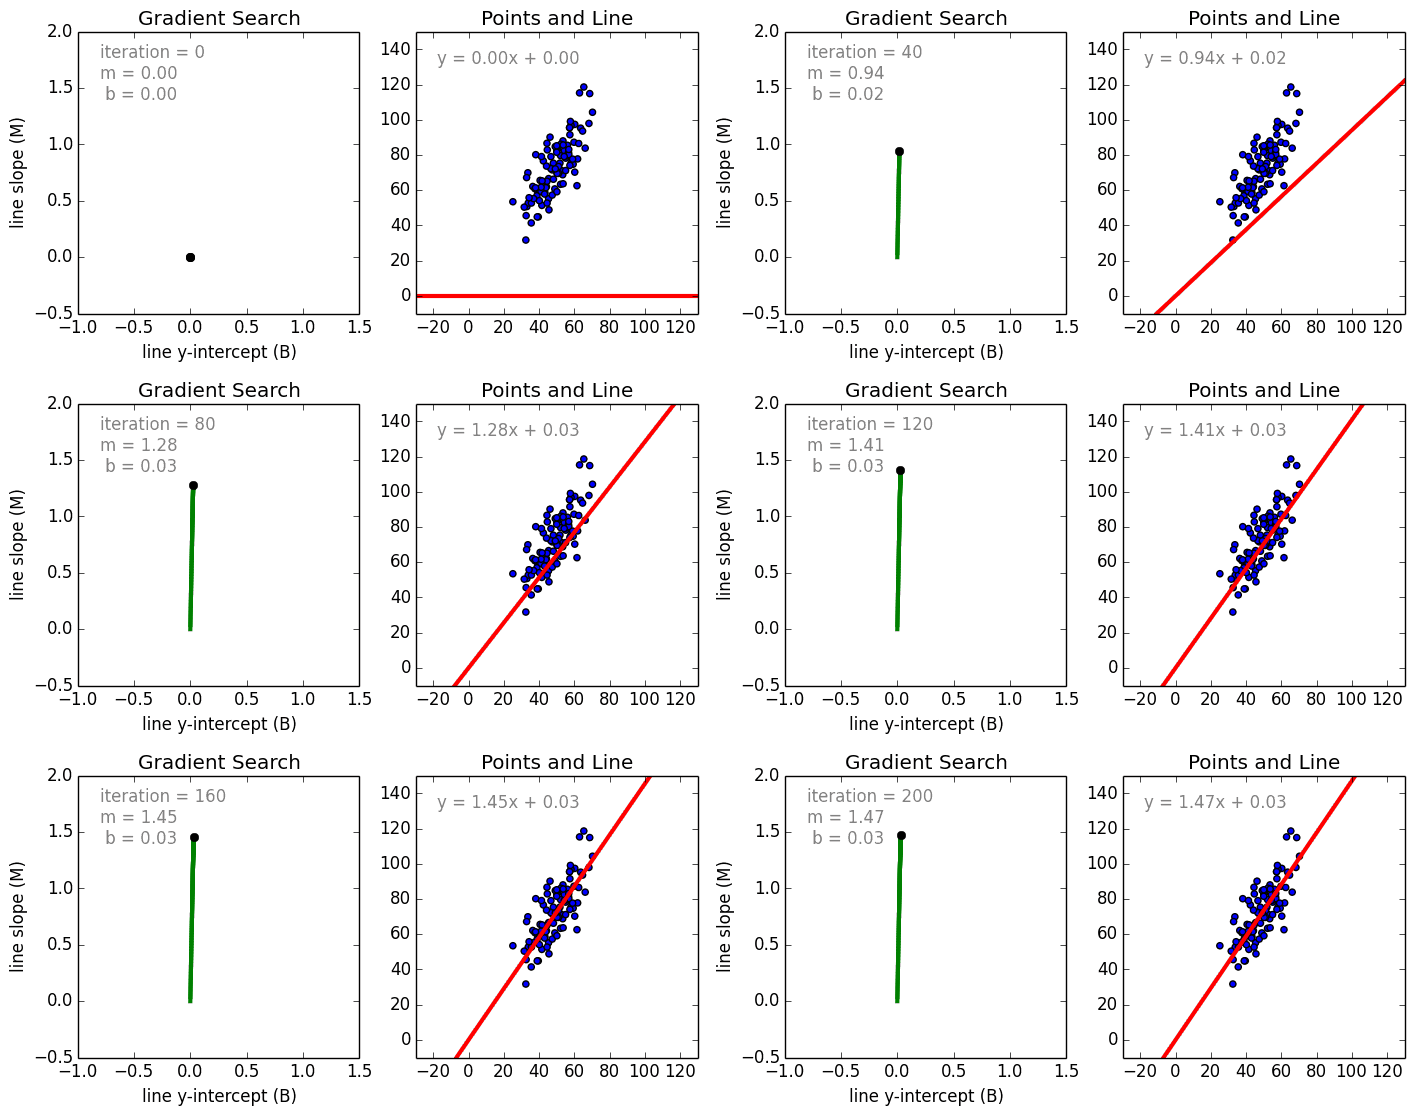
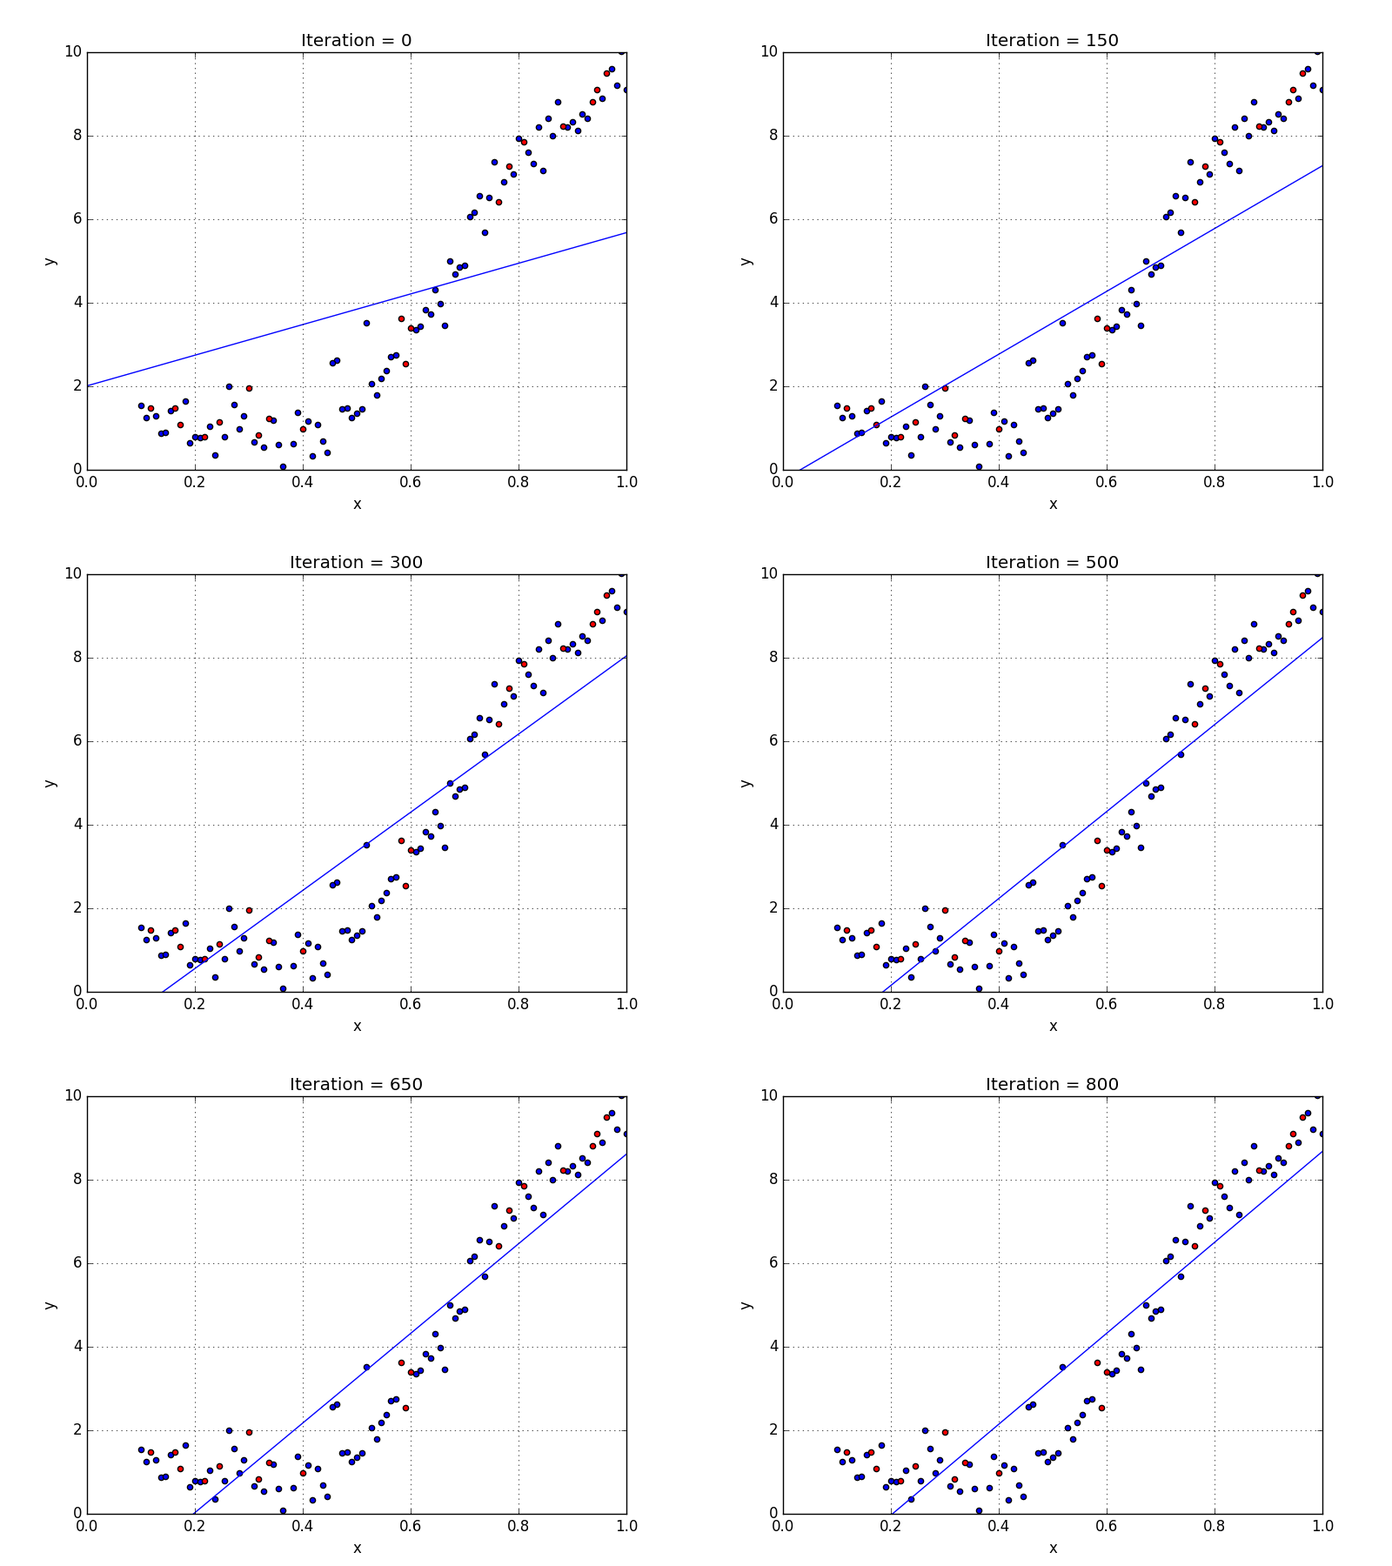
Regression is a technique used to model and analyze the relationships between variables and often times how they contribute and are related to producing a particular outcome together. A linear regression refers to a regression model that is completely made up of linear variables. Beginning with the simple case, Single Variable Linear Regression is a technique used to model the relationship between a single input independent variable and an output dependent variable using a linear model i.e a line.The more general case is Multi Variable Linear Regression where a model is created for the relationship between multiple independent input variables and an output dependent variable. The model remains linear in that the output is a linear combination of the input variables. We can model a multi-variable linear regression as the following:
Y = a1*X1 + a2*X2 + a3*X3 ……. an*Xn + b
Where an are the coefficients, Xn are the variables and b is the bias. As we can see, this function does not include any non-linearities and so is only suited for modelling linearly separable data. It is quite easy to understand as we are simply weighting the importance of each feature variable Xn using the coefficient weights an. We determine these weights a_n and the bias b using a Stochastic Gradient Descent (SGD).

A few key points about Linear Regression:
https://github.com/InternityFoundation/ML_Suraj_Durgesht/blob/master/linear_regression.py
- Fast and easy to model and is particularly useful when the relationship to be modeled is not extremely complex and if you don’t have a lot of data.
- Very intuitive to understand and interpret.
- Linear Regression is very sensitive to outliers.
Polynomial Regression
When we want to create a model that is suitable for handling non-linearly separable data, we will need to use a polynomial regression. In this regression technique, the best fit line is not a straight line. It is rather a curve that fits into the data points. For a polynomial regression, the power of some independent variables is more than 1. For example, we can have something like:Y = a1*X1 + (a2)²*X2 + (a3)⁴*X3 ……. an*Xn + b
We can have some variables have exponents, others without, and also select the exact exponent we want for each variable. However, selecting the exact exponent of each variable naturally requires some knowledge of how the data relates to the output. See the illustration below for a visual comparison of linear vs polynomial regression.

A few key points about Polynomial Regression:
- Able to model non-linearly separable data; linear regression can’t do this. It is much more flexible in general and can model some fairly complex relationships.
- Full control over the modelling of feature variables (which exponent to set).
- Requires careful design. Need some knowledge of the data in order to select the best exponents.
- Prone to over fitting if exponents are poorly selected.

No comments:
Post a Comment