Thursday, January 24, 2019

Support Vector Machine


Application support vetor machine:


  • Face detection
  • Text and hyper text categorization
  • classification of image
  • Bioinformatics

Why support vetor machine ?
why not build model which can predict an unknown data ?

This is "Support Vector Machine"

SVM is supervised learning method look at data and sorts into one of the two categories.

But how does the predict work ?

  1. Label sample data 
  2. Decision biundary
  3. Add new data(Unlabel)
  4. Plotting new data
  5. Predict the unknown
  6. Output

Example :
We are given a set of people with different,

  • Height
  • Weight

Sample data set                          Female                              Male

Let's add a new data point and figure out if it's a male or female ? we can split our data by choosing any of these line. But to predict the gender of a new data point we should plit the data in the best possible way. The line has the maximum space that separate the two classes. That is why this line best split the data. Well yes...This the best split! In technical terms, we can say that the distance between the support vector and hyperplane should be as far as possible. Where support vectors are the extreme points in the datasets. Any hyperplane has the maximum distance to the support.

 Here, D+ is the shortest distance to the closest positive point. D- is the shortest distance to the closest negative point.  Sum of D+ and D- is called the diance margin. from the distance margin, we get the optimal hyperplane. That was so clear! But what happens if a hyperplane is not optimal ?. If we select a hyperplane having low margin then there is high chance to misclassification. What we discussed so far, is also called as LSVM.

Advantages of support vector machine:

  • High diamentional input space
  • sparse document vectors
  • regularization parameter


Tuesday, January 22, 2019

Neural Networks

 What's in it for you ?

  • What is neural networks ?
  • What can neural network do?
  • How does neural network works ?
  • Types of neural network.
  • Use case.
 
Hi guys! I heard you what you know what neural network is ? As a matter of fact, you have been using neural network on daily basis. When you ask your mobile assistant to perform search for you..

Self driving car use it.
Computer game use it.
Also use in processing the map image on your phone.

What is neural network?

"Neural network is a system or hardware that is designed to operate like human brain."

What can neural network do?

let's list out the things neural network can do for you. 
  • Translate text
  • Identify face
  • recognize speech
  • Read handwritten text
  • Control robots 
  • And lot of other things..

How does neural network works? 

There are different layer of a neural network.
 Input layer : pick up input signal and passes them to the next layer.
Hidden layer : does all kind of calculation and feature extraction.
Output layer : This layer deliver the final result.

Let's consider the image of this vehicle and find out what's on the number plate. 28*28 pixels of the imge is fed as input to identify registeration plate. Each nuran has a number called activation that represents the grayscale value of the corresponding pixel ranging from 0 to 1.1 for white pixel and for black pixel. Each neuron is lit up when it's activation is close to 1. pixel in the from of array are fed to the input layer. let's name the input x1, x2 and x3 respectively. Input layer passes it to hidden layer. The interaction are assigned weight at random. The weight are multilied with the input signal and a bias is added to all of them.


The weighted sum of input is fed as to the activation function to decide which nodes to fire for feature extraction. As the siganal flows within the hidden layers, The weighted sum of input is calculated and fed the activation function in each layer to decide which nodes to fire. Ther are different activation funtions:


  • Sigmoid Function: used when the model is predicting probobility.
  • Thresold Function: used when the output depend on a tresold values.
  • Relu Function: It gives x if x is positive, otherwise.
  • Hyperbolic tangent Function: Similar to sigmoid function with a range of (-1, 1).

Finally , The model would predict the outcomes by applying suitable activation function to output layer. identifies the number plate. Optical character recognition (OCR) is used on the the image to convert it into text in order to identify what's written on the plate. Error in th output is backpropogated through the network and weightd are adjusted to minimize the error rate. This is calculated by a cost function.


Types of Neural Network:

  • Feedforword Neural Network: 

simplest form of ANN data travels only in one direction (input-output). 
Application - vision and speech recognition.

  • Radial Basis Function Neural Network:

This model classifies the data point based on it's distance from a center point.
Application - power restoration system.

  • Kohonen Self Organizing Neural Network:

Vector of random diamentions are input to discrete map comprised of neurons.
Application - used to recognize patterns in data like in medical analysis.


  • Recurrent Neural Network:

The hidden layer saves its output to be used for future prediction.
Application - text to speech conversion model.

  • Convolution Nural Network:

The input features are taken in batches like a filter. This allows the network to remember an image parts.
Application - used in signal and image processing.


  • Modular Neural Network:


It has collection of different neural netwoks working together to get output.
Application - still under-going research.

Monday, January 14, 2019

K-Nearest Neighbours

K-Nearest Neighbors is one of the most basic essential classification algorithms in Machine Learning. It belongs to the supervised learning domain and finds intense application in pattern recognition, data mining and intrusion detection.
we are given a data set of items, each having numerically valued features (like Height, Weight, Age, etc). If the count of features is n, we can represent the items as points in an n-dimensional grid. Given a new item, we can calculate the distance from the item to every other item in the set. We pick the kclosest neighbors and we see where most of these neighbors are classified in. We classify the new item there.
We are given some prior data (also called training data), which classifies coordinates into groups identified by an attribute.

As an example, consider the following table of data points containing two features:

Now, given another set of data points (also called testing data), allocate these points a group by analyzing the training set. Note that the unclassified points are marked as ‘White’.

Algorithm
Given a new item:
    1. Find distances between new item and all other items
    2. Pick k shorter distances
    3. Pick the most common class in these k distances
    4. That class is where we will classify the new item

Thursday, January 10, 2019

Logistic Regression using Tensorflow

Logistic Regression is Classification algorithm commonly used in Machine Learning. It allows categorizing data into discrete classes by learning the relationship from a given set of labeled data. It learns a linear relationship from the given dataset and then introduces a non-linearity in the form of the Sigmoid function.

In case of Logistic regression, the hypothesis is the Sigmoid of a straight line, i.e,
 h(x) = \sigma(wx + b)  
where
  \sigma(z) = \frac{1}{1 + e^{-z}}
Where the vector w represents the Weights and the scalar b represents the Bias of the model.
Note that the range of the Sigmoid function is (0, 1) which means that the resultant values are in between 0 and 1. This property of Sigmoid function makes it a really good choice of Activation Function for Binary Classification. Also for z = 0, Sigmoid(z) = 0.5 which is the midpoint of the range of Sigmoid function.
Just like Linear Regression, we need to find the optimal values of w and b for which the cost function Jis minimum. In this case, we will be using the Sigmoid Cross Entropy cost function which is given by
 J(w, b) = -\frac{1}{m} \sum_{i=1}^{m}(y_i * log(h(x_i)) + (1 - y_i) * log(1 - h(x_i)))
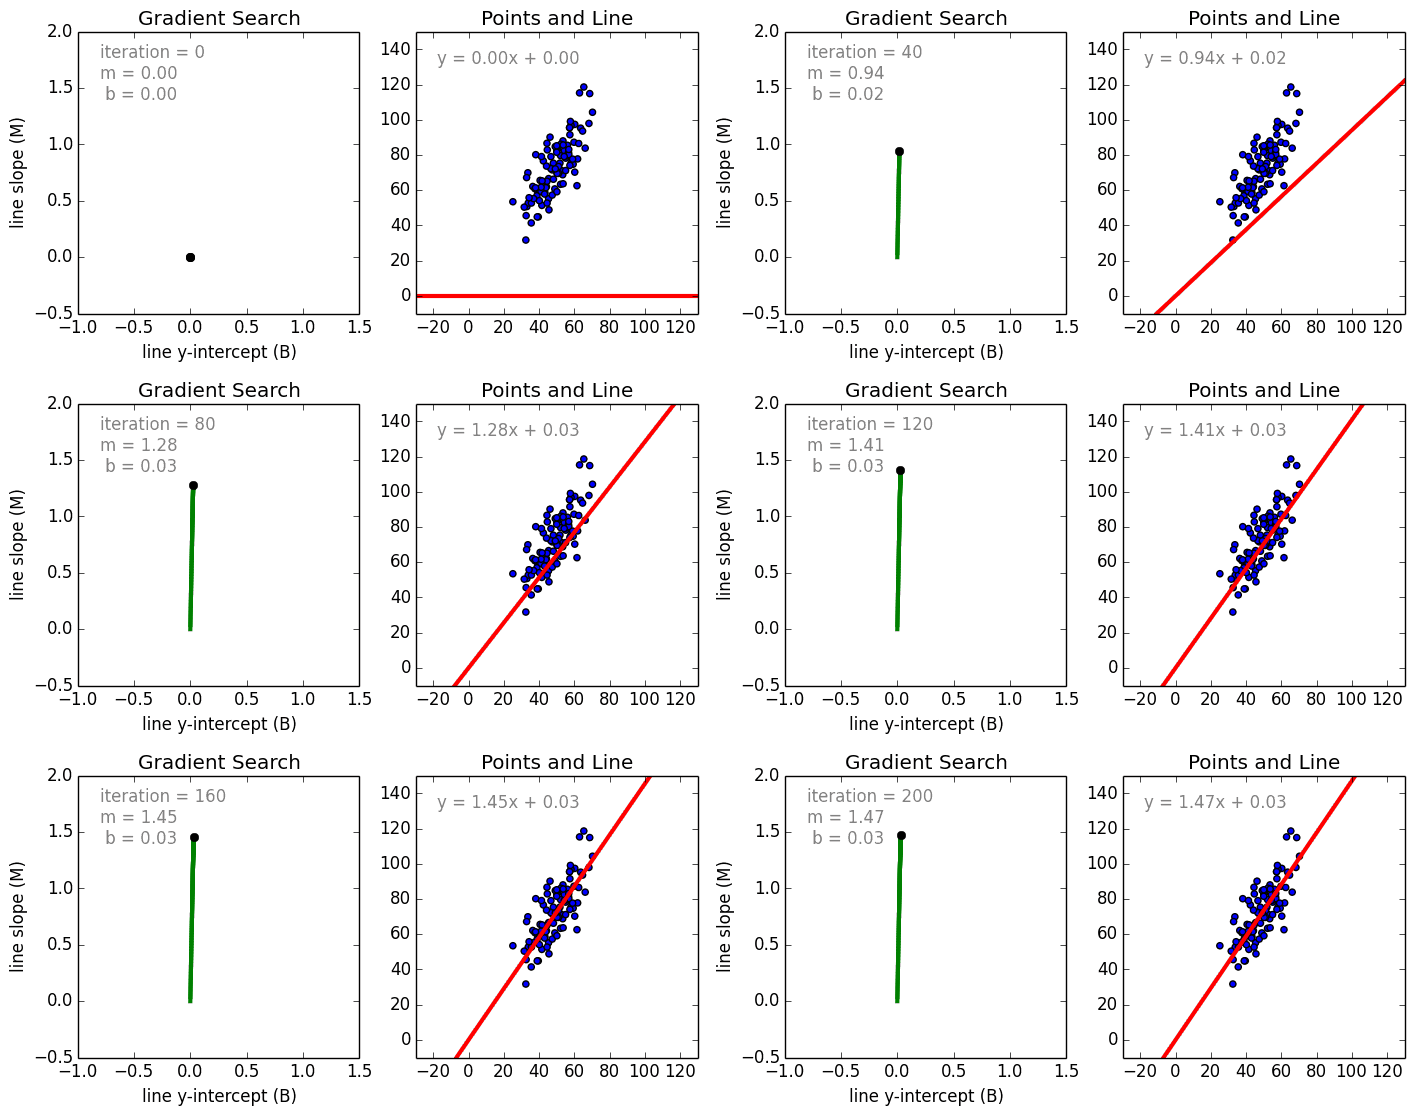
This cost function will then be optimized using Gradient Descent.
Implementation:
We will start by importing the necessary libraries. We will use Numpy along with Tensorflow for computations, Pandas for basic Data Analysis and Matplotlib for plotting. We will also be using the preprocessing module of Scikit-Learn for One Hot Encoding the data.

Decision Tree Regression using sklearn


Decision Tree is a decision-making aproach that uses a flowchart-like tree structure of decisions and all of their possible results, including outcomes, input costs and utility.
Decision-tree algorithm falls under the category of supervised learning algorithms. It works for both continuous as well as categorical output variables.
The branches/edges represents as:
  1. Conditions [Decision Nodes]
  2. Result [End Nodes]
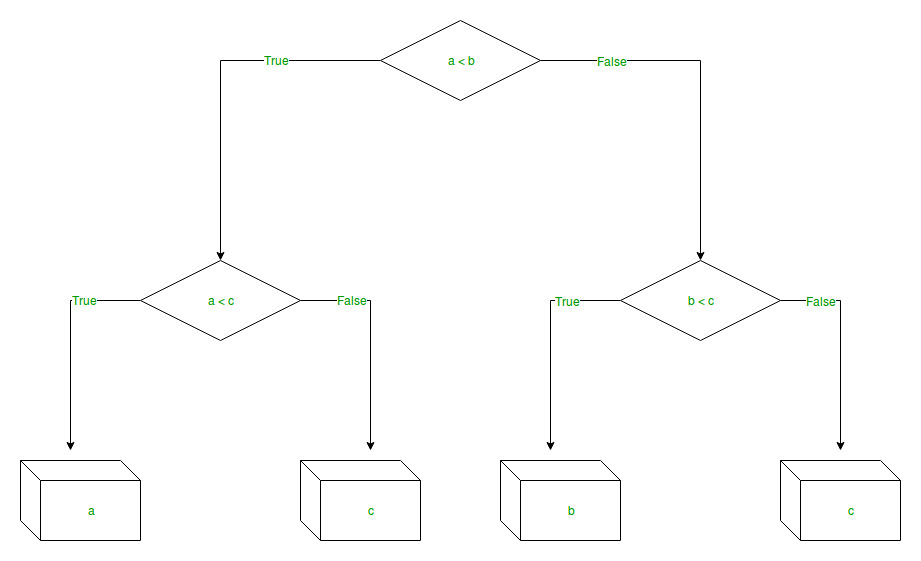
The branches/edges represent the truth/falsity of the statement and takes makes a decision based on that in the example below which shows a decision tree that evaluates the smallest of three numbers:

Step-by-Step implementation –
Step 1: Import the required libraries.
Step 2: Initialize and print the Dataset.
Step 3: Select all the rows and column 1 from dataset to “X”.
Step 4: Select all of the rows and column 2 from dataset to “y”.
Step 5: Fit decision tree regressor to the dataset
Step 6: Predicting a new value
Step 7: Visualising the result
Step 8: The tree is finally exported and shown in the TREE STRUCTURE below, visualized using http://www.webgraphviz.com/ by copying the data from the ‘tree.dot’ file.

Thursday, January 3, 2019

Linear Regression

Linear regression predicts a real-valued output based on an input value. 
Regression is a technique used to model and analyze the relationships between variables and often times how they contribute and are related to producing a particular outcome together. A linear regression refers to a regression model that is completely made up of linear variables. Beginning with the simple case, Single Variable Linear Regression is a technique used to model the relationship between a single input independent variable and an output dependent variable using a linear model i.e a line.

The more general case is Multi Variable Linear Regression where a model is created for the relationship between multiple independent input variables and an output dependent variable. The model remains linear in that the output is a linear combination of the input variables. We can model a multi-variable linear regression as the following:

Y = a1*X1 + a2*X2 + a3*X3 ……. an*Xn + b

Where an are the coefficients, Xn are the variables and b is the bias. As we can see, this function does not include any non-linearities and so is only suited for modelling linearly separable data. It is quite easy to understand as we are simply weighting the importance of each feature variable Xn using the coefficient weights an. We determine these weights a_n and the bias b using a Stochastic Gradient Descent (SGD).


A few key points about Linear Regression:
https://github.com/InternityFoundation/ML_Suraj_Durgesht/blob/master/linear_regression.py

  • Fast and easy to model and is particularly useful when the relationship to be modeled is not extremely complex and if you don’t have a lot of data.
  • Very intuitive to understand and interpret.
  • Linear Regression is very sensitive to outliers.


Polynomial Regression

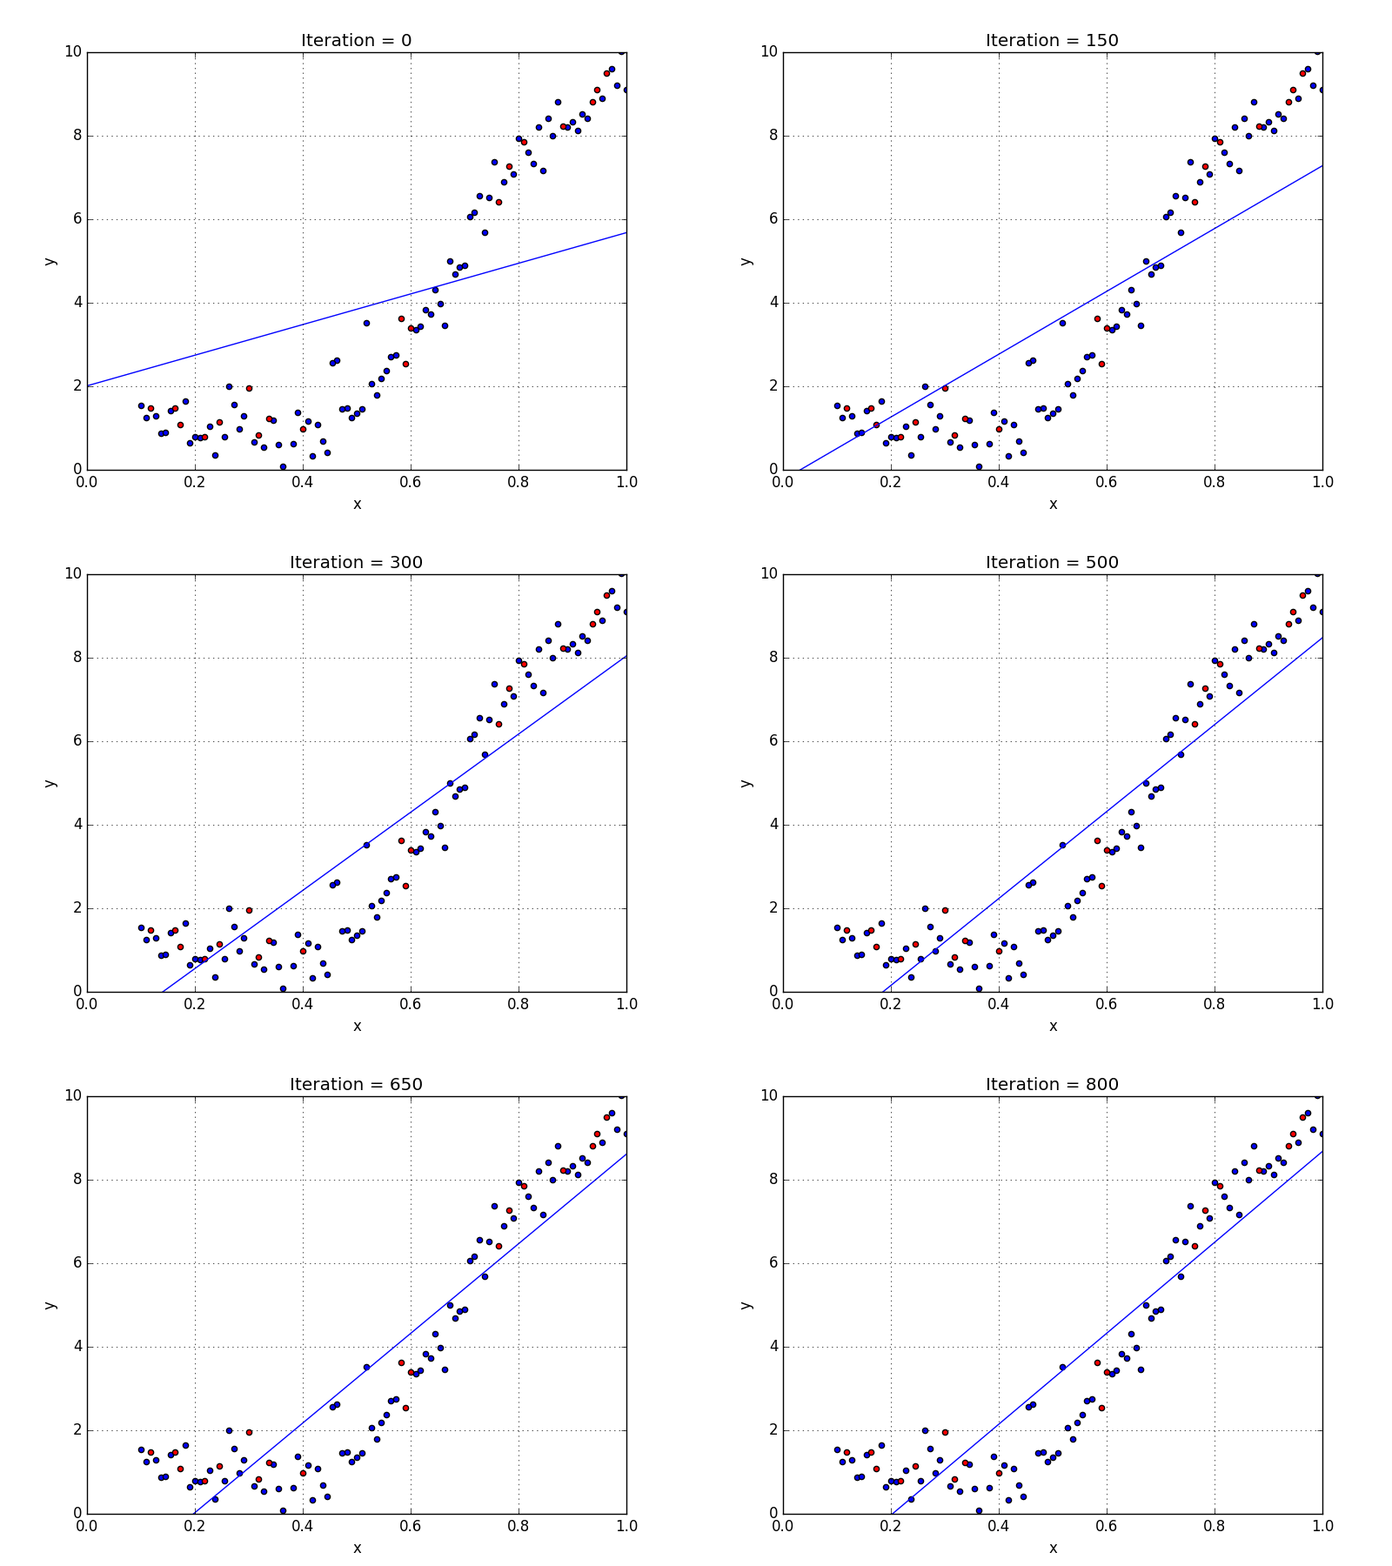
When we want to create a model that is suitable for handling non-linearly separable data, we will need to use a polynomial regression. In this regression technique, the best fit line is not a straight line. It is rather a curve that fits into the data points. For a polynomial regression, the power of some independent variables is more than 1. For example, we can have something like:

Y = a1*X1 + (a2)²*X2 + (a3)⁴*X3 ……. an*Xn + b

We can have some variables have exponents, others without, and also select the exact exponent we want for each variable. However, selecting the exact exponent of each variable naturally requires some knowledge of how the data relates to the output. See the illustration below for a visual comparison of linear vs polynomial regression.

A few key points about Polynomial Regression:


  • Able to model non-linearly separable data; linear regression can’t do this. It is much more flexible in general and can model some fairly complex relationships.
  • Full control over the modelling of feature variables (which exponent to set).
  • Requires careful design. Need some knowledge of the data in order to select the best exponents.
  • Prone to over fitting if exponents are poorly selected.


Conclusion

 All of these regression regularization methods work well in case of high dimensionality and multicollinearity among the variables in the data set.

Training and deploying machine learning models using Python

These steps are:

  • Specify Performance Requirements.
  • Separate Prediction Algorithm From Model Coefficients.
  • Develop Regression Tests For Your Model.
  • Develop Back-Testing and Now-Testing Infrastructure.
  • Challenge Then Trial Model Updates.

Getting a dataset

Machine learning projects are finding good datasets. If the dataset is bad, or too small, we cannot make accurate predictions. You can find some good datasets at Kaggle.
Features are independent variables which affect the dependent variable called the label.
In this case, we have one label column  wine quality  that is affected by all the other columns (features like pH, density, acidity, and so on).
I use a library called pandas to control my dataset. pandas provides datasets with many functions to select and manipulate data.
First, I load the dataset to a panda and split it into the label and its features. I then grab the label column by its name (quality) and then drop the column to get all the features.

import pandas as pd
#loading our data as a panda
df = pd.read_csv('winequality-red.csv', delimiter=";")
#getting only the column called quality
label = df['quality']
#getting every column except for quality
features = df.drop('quality', axis=1)
Training a model

Machine learning works by finding a relationship between a label and its features. We do this by showing an object (our model) a bunch of examples from our dataset. Each example helps define how each feature affects the label. We refer to this process as training our model.
I use the estimator object from the Scikit-learn library for simple machine learning. Estimators are empty models that create relationships through a predefined algorithm.
For this wine dataset, I create a model from a linear regression estimator. (Linear regression attempts to draw a straight line of best fit through our dataset.) The model is able to get the regression data through the fit function. I can use the model by passing in a fake set of features through the predict function. The example below shows the features for one fake wine. The model will output an answer based on its training.
The code for this model, and fake wine, is below:

import pandas as pd
import numpy as np
from sklearn import linear_model
#loading and separating our wine dataset into labels and features
df = pd.read_csv('winequality-red.csv', delimiter=";")
label = df['quality']
features = df.drop('quality', axis=1)
#defining our linear regression estimator and training it with our wine data
regr = linear_model.LinearRegression()
regr.fit(features, label)
#using our trained model to predict a fake wine
#each number represents a feature like pH, acidity, etc.
print regr.predict([[7.4,0.66,0,1.8,0.075,13,40,0.9978,3.51,0.56,9.4]]).tolist()
Importing and exporting our Python model

The pickle library makes it easy to serialize the models into files that I create. I am also able to load the model back into my code. This allows me to keep my model training code separated from the code that deploys my model.
I can import or export my Python model for use in other Python scripts with the code below:

import pickle
#creating and training a model
regr = linear_model.LinearRegression()
regr.fit(features, label)
#serializing our model to a file called model.pkl
pickle.dump(regr, open("model.pkl","wb"))
#loading a model from a file called model.pkl
model = pickle.load(open("model.pkl","r"))

Wednesday, January 2, 2019


What is Machine Learning?

Arthur Samuel described: " The field of study that gives computers the ability to learn without being explicitly programmed. " This is an older, informal definition.
Tom Mitchell provides a more modern definition: " A computer program is said to learn from experience E with respect to some class of tasks T and performance measure P, if its performance at tasks in T, as measured by P, improves with experience E. "
Example: playing checkers.
E = the experience of playing many games of checkers
T = the task of playing checkers.
P = the probability that the program will win the next game.
Three main different categories:
  • Supervised Learning – Train Me!
  • Unsupervised Learning – I am self sufficient in learning
  • Reinforcement Learning – My life My rules! (Hit & Trial)

  Supervised machine learning :

In supervised learning, we are given a data set and already know what our correct output should look like, having the idea that there is a relationship between the input and the output.
Supervised learning problems are categorized into "regression" and "classification" problems. In a regression problem, we are trying to predict results within a continuous output, meaning that we are trying to map input variables to some continuous function. In a classification problem, we are instead trying to predict results in a discrete output. In other words, we are trying to map input variables into discrete categories.

Example 1:
Given data about the size of houses on the real estate market, try to predict their price. Price as a function of size is a continuous output, so this is a regression problem.
We could turn this example into a classification problem by instead making our output about whether the house "sells for more or less than the asking price." Here we are classifying the houses based on price into two discrete categories.
Example 2:
(a) Regression - Given a picture of a person, we have to predict their age on the basis of the given picture
(b) Classification - Given a patient with a tumor, we have to predict whether the tumor is malignant or benign.

some other examples:

  • loan approved/rejected
  • spam detection
  • image classification
  • medical diagnostic system
  • stock price prediction

Unsupervised machine learning : 

      Unsupervised learning allows us to approach problems with little or no idea what our results should look like. We can derive structure from data where we don't necessarily know the effect of the variables.
We can derive this structure by clustering the data based on relationships among the variables in the data.
With unsupervised learning there is no feedback based on the prediction results.

Example:
Clustering: Take a collection of 1,000,000 different genes, and find a way to automatically group these genes into groups that are somehow similar or related by different variables, such as lifespan, location, roles, and so on.

Non-clustering: The "Cocktail Party Algorithm", allows you to find structure in a chaotic environment. 

some examples:

  • fraud detection
  • image segmentation
  • customer segmentation
  • market analysis

Reinforcement machine learning:

Decision made by the system on the basis of the reward it received for the last action it performed.
It usually learn optimal actions through trial and error.

some examples: 

  • robotics – where a robot can learn to avoid collisions by receiving negative feedback after bumping into obstacles.
  • video games – where trial and error reveals specific movements that can shoot up a player’s rewards.


Support Vector Machine Application support vetor machine: Face detection Text and hyper text categorization classification of im...